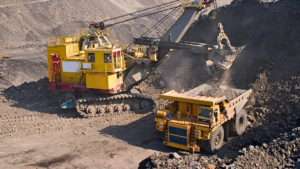
Saudi Arabia’s Industrial Production Index increased 8.9% year over year, driven primarily by mining and quarrying, which grew 13.0% compared with February 2025. Even on a shorter-term basis, mining momentum also remained positive with a 0.1% month-on-month gain. The Kingdom’s industrial base benefited from a rise in oil production from 8.9 million barrels per day to 10.1 million barrels per day, highlighting the importance of extractive activities.
While the industrial performance was strong in January 2026, the overall index slipped 0.2%, suggesting a mild cooling in monthly activity despite a strong annual performance. Even as some other industrial categories slowed in February 2026, the mining and minerals industry still showed expansion and resilience, as well as continued support from hydrocarbons.
Main Industrial Results
| Indicator | February 2026 vs February 2025 | February 2026 vs January 2026 | Analysis |
| Industrial Production Index | +8.9% | -0.2% | Strong yearly expansion, slight monthly slowdown. |
| Mining and quarrying | +13.0% | +0.1% | Clear driver of industrial growth, stable month to month. |
| Manufacturing | +3.6% | -0.2% | Positive annual growth, but softer recent momentum. |
| Electricity, gas, steam, and air conditioning supply | -3.7% | -3.9% | Weakness in utilities-related industrial activity. |
| Water supply, sewerage, waste management, and remediation | +8.1% | -4.1% | Strong annual improvement, but monthly pullback. |
The mining sector performed well among the major industrial categories, doing the heavy lifting for the broader index. Despite a one-time spike, mining output levels remained fairly steady during the month, increasing by 0.1%.
Manufacturing Sub-Activities
Manufacturing also helped support the industrial index, but its growth was more moderate than mining.
| Manufacturing Sub-Activity | Annual Change | Monthly Change | What it Means |
| Manufacture of coke and refined petroleum products | +5.2% | -0.8% | Still expanding annually, but softer in February. |
| Manufacture of chemicals and chemical products | +4.5% | -1.4% | Healthy annual growth, but weaker monthly output. |
| Manufacture of food products | +5.8% | +1.6% | One of the stronger monthly performers. |
| Manufacture of non-metallic products | +2.2% | -0.8% | Mild annual gain, monthly decline. |
| Manufacture of basic metals | +6.2% | -2.0% | Important for mining downstream, but monthly softness was clear. |
| Manufacture of beverages | +0.1% | -0.3% | Essentially flat annually. |
| Manufacture of paper and paper products | +1.9% | +2.0% | Positive monthly recovery. |
| Manufacture of electrical devices | -3.2% | +0.3% | Annual weakness, slight monthly rebound. |
| Manufacture of furniture | +0.1% | +1.8% | Small gains after a flat annual result. |
| Other economic activities | +0.2% | +1.6% | Broadly stable. |
The most relevant line in mining and minerals is basic metals, which grew 6.2%. It indicates downstream industrial demand for mineral processing and metal-based supply chains. There is some short-term easing in metal-linked activity, but the annual rise still indicates a positive industrial environment.
Utilities and Environmental Services
These sectors indirectly affect mining operations through energy, water, and waste management inputs.
| Activity | Annual Change | Monthly Change | Relevance to Mining |
| Electricity, gas, steam, and air conditioning supply | -3.7% | -3.9% | Indicates softer energy-support activity. |
| Water supply, sewerage, waste management, and remediation | +8.1% | -4.1% | Annual improvement, but monthly slowdown. |
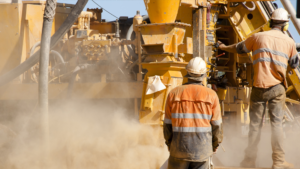
Mining companies consider electricity and water to be core operating inputs. . Electricity-related activity may have declined due to weaker industrial utility demand or operational issues, while water and remediation activity gained due to stronger support services.
Oil and Non-Oil Activities
| Main Activity | Annual Change | Monthly Change | Index Level / Notes |
| Oil activities | +11.5% | -0.1% | Strong annual expansion, nearly flat month to month. |
| Non-oil activities | +2.4% | -0.4% | Positive annual growth, but weaker monthly performance. |
The Saudi report’s oil activities result is particularly important since mining and quarrying are strongly influenced by crude production. Despite a rise of 11.5% annually, extractive activity remained robust and remained a major pillar of industrial growth. Diversification is progressing, but at a slower pace than the hydrocarbon-driven segment, as evidenced by the 2.4% rise in non-oil activities.
Outlook for Mining Sector
Both strategically and operationally, February 2026 looked promising for the mining industry. The 13.0% annual growth in mining and quarrying indicates the sector is expanding strongly.
Furthermore, the report indicates that mining was still closely linked to oil production. From a mining industry perspective, this environment still matters because strong extraction output supports processing, transport, industrial services, and investment sentiment.