Saudi Mining recorded a 21.8% increase in valid mining licenses in 2025, bringing the total to 2,925, while the cumulative number of discovered mineralization sites reached 5,680, according to the latest Mineral Resources Statistics 2025 released by Saudi Arabia’s General Authority for Statistics (GASTAT).
The report, published in October 2026, provides a statistical overview of the sector from 2021 to 2025, covering mining licenses, discovered mineralization sites, mining reserves, and international trade in minerals and mineral products.
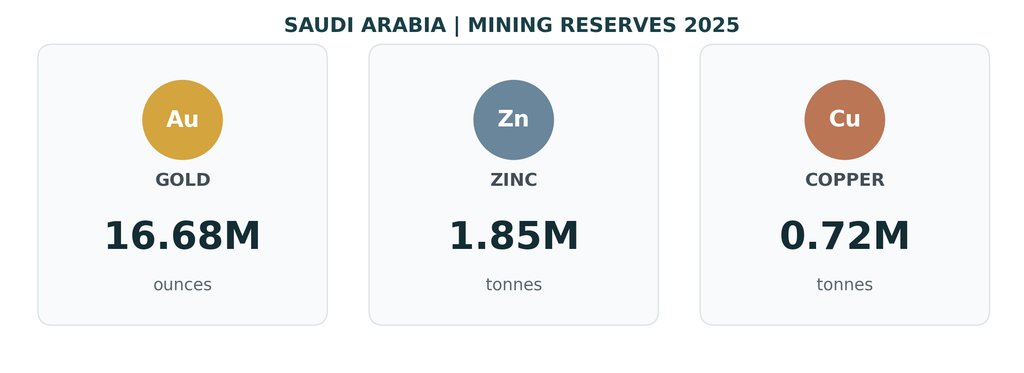
Alongside the increase in mining licenses, the latest Saudi mining figures recorded approximately 16.68 million ounces of gold reserves, 1.85 million tonnes of zinc reserves, and 0.72 million tonnes of copper reserves.
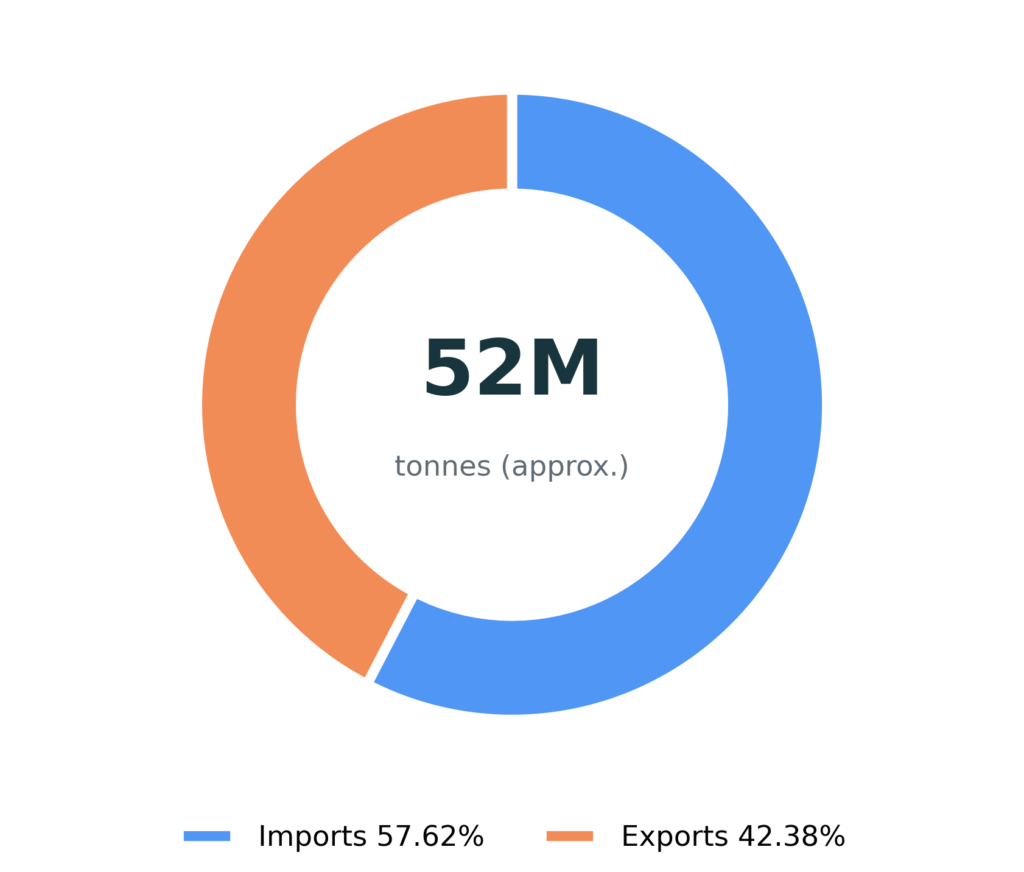
Saudi Arabia’s combined mineral and mineral-product imports and exports reached approximately 52 million tonnes in 2025, with imports accounting for 57.62% of total trade volume.
Saudi Mining Licenses Jump 21.8% to 2,925
The number of valid mining licenses in Saudi Arabia increased from 2,401 in 2024 to 2,925 in 2025, representing an additional 524 licenses.
According to GASTAT’s Mineral Resources Statistics 2025, the total number of valid licenses increased by 48.70% compared with 2021, when Saudi Arabia recorded 1,967 licenses.
Five Years of Saudi Mining License Growth
The number of valid mining licenses rose from 1,967 in 2021 to 2,300 in 2022, followed by 2,355 in 2023 and 2,401 in 2024, before reaching 2,925 in 2025.
| Year | Valid mining licenses |
|---|---|
| 2021 | 1,967 |
| 2022 | 2,300 |
| 2023 | 2,355 |
| 2024 | 2,401 |
| 2025 | 2,925 |
Saudi Mining Licenses, 2021–2025
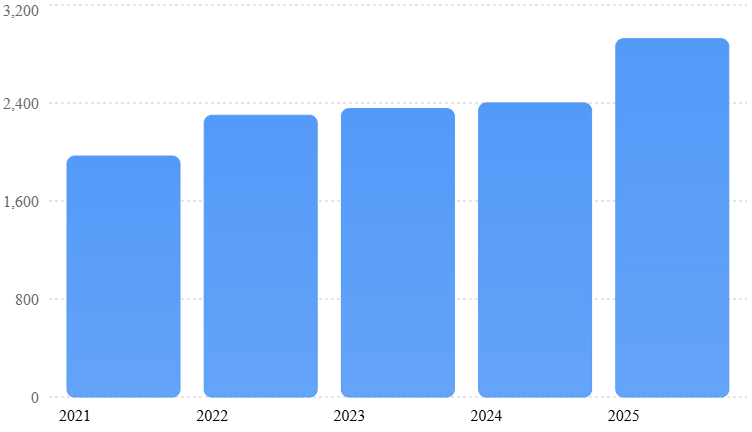
The largest year-on-year increase in the reported five-year period occurred in 2025, when valid licenses rose by 524, compared with an increase of 46 between 2023 and 2024.
Riyadh Accounts for Nearly One-Third of Saudi Mining Licenses
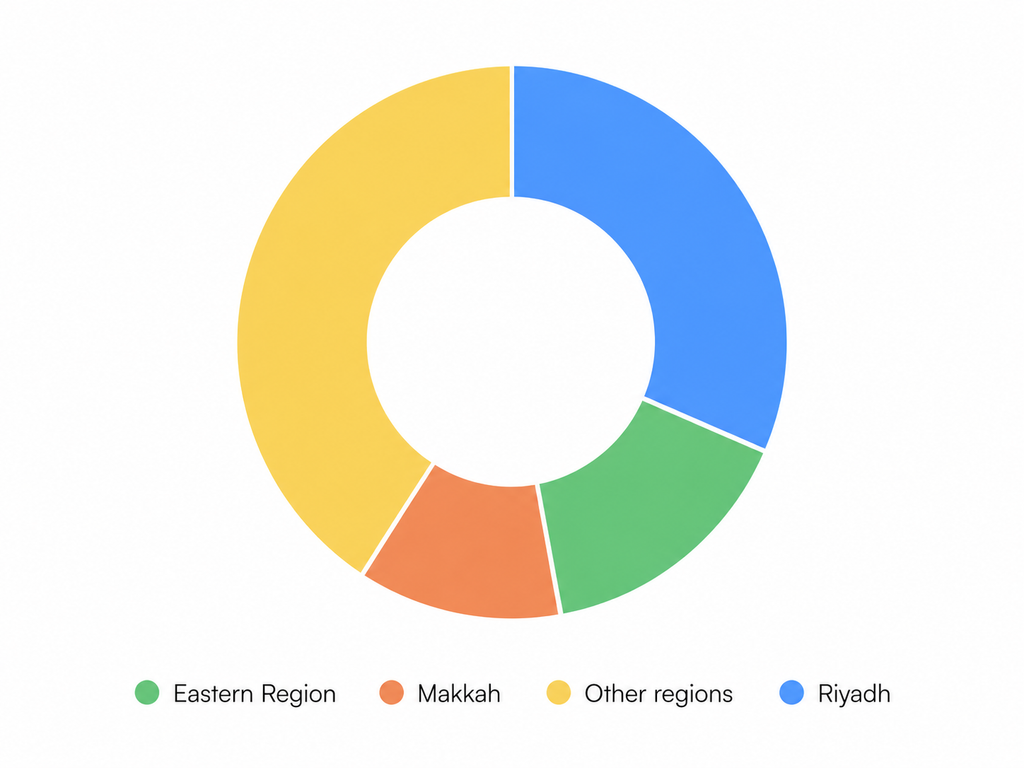
Riyadh held the largest share of valid mining licenses in 2025, accounting for 31.56% of the national total.
The Eastern Region ranked second with 15.62%, followed by Makkah at 11.73%.
Together, the three regions accounted for 58.91% of all valid mining licenses in Saudi Arabia.
| Region | Share of valid licenses |
|---|---|
| Riyadh | 31.56% |
| Eastern Region | 15.62% |
| Makkah | 11.73% |
| Other regions combined | 41.09% |
Regional Distribution of Mining Licenses, 2025
Saudi Arabia’s Discovered Mineralization Sites Reach 5,680
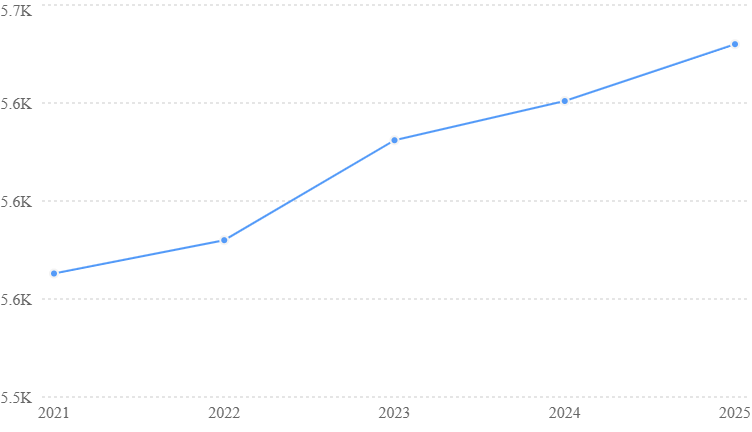
Saudi Arabia’s cumulative number of discovered mineralization sites reached 5,680 by the end of 2025, an increase of 29 sites compared with the 5,651 recorded in 2024.
| Year | Cumulative mineralization sites | Annual increase shown by GASTAT |
|---|---|---|
| 2021 | 5,563 | 34 |
| 2022 | 5,580 | 17 |
| 2023 | 5,631 | 51 |
| 2024 | 5,651 | 20 |
| 2025 | 5,680 | 29 |
Discovered Mineralization Sites, 2021–2025
Non-Metallic Minerals Account for Nearly 54% of Discovered Sites
GASTAT classified Saudi Arabia’s discovered mineralization sites into three categories in 2025.
Non-metallic minerals accounted for 53.98% of the cumulative total, while metallic mineral sites represented 43.03%. Sites containing both metallic and non-metallic minerals accounted for the remaining 2.99%.
| Mineralization category | Share of total sites |
|---|---|
| Non-metallic minerals | 53.98% |
| Metallic minerals | 43.03% |
| Metallic and non-metallic minerals | 2.99% |
Al-Baha Leads Saudi Arabia in Mineralization Site Density
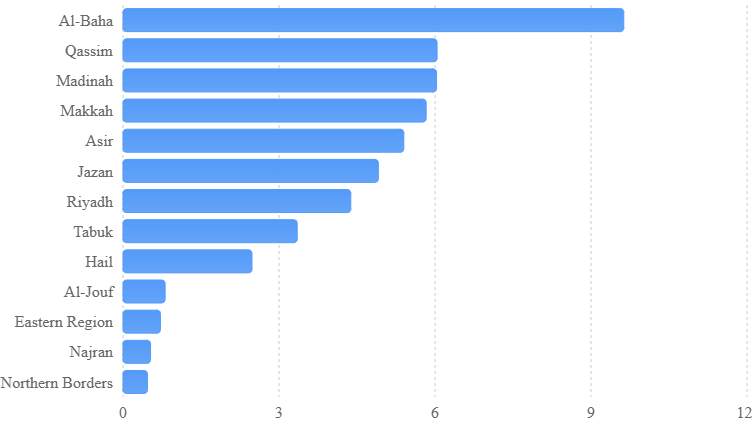
Al-Baha recorded the highest density of discovered mineralization sites in 2025, at 9.63 sites per 1,000 square kilometers.
Qassim followed with 6.04 sites per 1,000 square kilometers, while Madinah recorded 6.03.
According to GASTAT’s regional figures, the Northern Borders region had the lowest density, at 0.47 sites per 1,000 square kilometers.
Mineralization Site Density by Region, 2025
Saudi Mining Reserves Include 16.68 Million Ounces of Gold
Saudi Arabia reported approximately 16.68 million ounces of gold mining reserves, 1.85 million tonnes of zinc mining reserves, and 0.72 million tonnes of copper mining reserves in 2025.
Saudi Mineral Trade Reaches 52 Million Tonnes
Saudi Mining trade statistics showed that combined imports and exports of minerals and mineral products totaled approximately 52 million tonnes in 2025.52 million tonnes in 2025.
Imports accounted for approximately 30 million tonnes, representing 57.62% of total trade volume, while exports reached approximately 22 million tonnes, equivalent to 42.38%.
Phosphatic Fertilizers Top Major Mineral Export Volumes
Phosphatic fertilizers recorded the highest export volume among the major mineral commodities listed by GASTAT in 2025, at 6.437 million tonnes.
Copper exports followed at 336,000 tonnes, while unwrought aluminum exports reached 191,000 tonnes and zinc exports totaled 119,000 tonnes.
On the import side, iron recorded the largest reported volume among the listed commodities, at 1.86 million tonnes, followed by unwrought aluminum at 222,000 tonnes.
| Commodity | Exports (thousand tonnes) | Imports (thousand tonnes) |
|---|---|---|
| Phosphatic fertilizers | 6,437 | 54 |
| Copper | 336 | 4 |
| Zinc | 119 | 0.28 |
| Unwrought aluminum | 191 | 222 |
| Iron | 20 | 1,860 |
The figures reproduce the commodity labels and rounded quantities published in GASTAT’s statistical summary.
Saudi Mining Fertilizer Exports More Than Double Since 2021
Saudi Arabia’s fertilizer exports increased from 2.881 million tonnes in 2021 to 6.449 million tonnes in 2025, according to GASTAT’s five-year fertilizer trade series.
In 2025, total fertilizer exports reached 6.449 million tonnes, compared with 158,000 tonnes of imports.
Fertilizer Exports Rise to 6.449 Million Tonnes
GASTAT recorded the following fertilizer export and import volumes between 2021 and 2025.
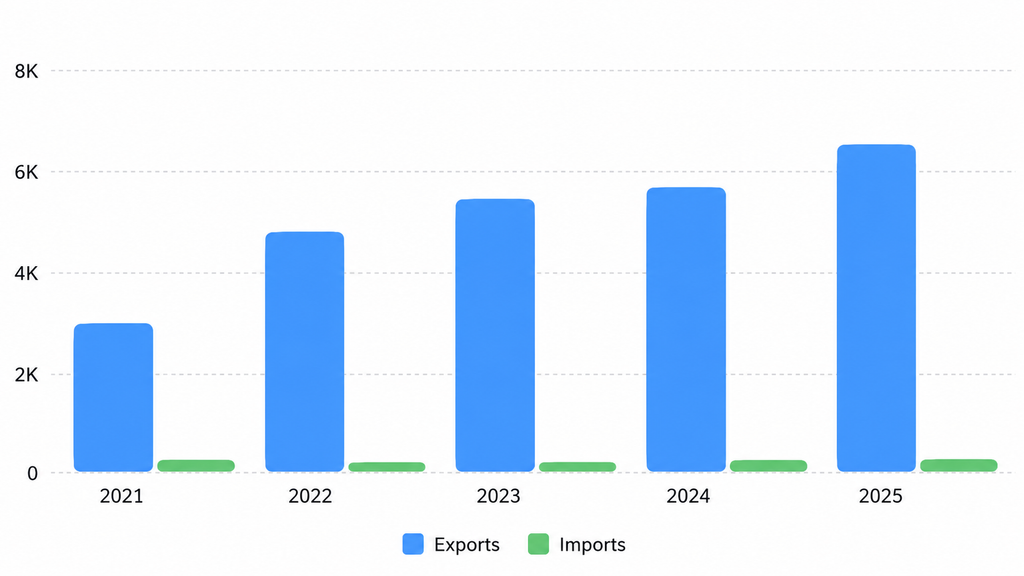
Based on the published figures, fertilizer exports increased by approximately 13.3% between 2024 and 2025 and by approximately 123.8% compared with 2021.
DAP Exports Reach 4.663 Million Tonnes
Diammonium phosphate (DAP) was the leading fertilizer export product in 2025, with a reported volume of 4.663 million tonnes.
DAP accounted for approximately 72.3% of total fertilizer exports, based on GASTAT’s reported quantities.
Potassium fertilizers accounted for the largest reported fertilizer import category, at 105,000 tonnes.
Precious Metals Imports Reach 348 Tonnes
Saudi Arabia imported 348 tonnes of precious metals in 2025, compared with exports totaling 23 tonnes.
Platinum accounted for the largest reported import quantity, at 131 tonnes, followed by silver at 123 tonnes and gold at 94 tonnes.
Gold exports reached 20 tonnes, while silver exports totaled 3 tonnes, according to GASTAT.
Precious Metals Imports, 2025
The publication identifies gold, silver, and platinum as the precious metals covered by this category. It does not provide a separate platinum export figure in the summary.
Saudi Mining in Numbers: Key Findings from 2025
The latest Saudi Mining statistics recorded 2,925 valid licenses, 5,680 cumulative discovered mineralization sites, and approximately 52 million tonnes of mineral and mineral-product trade in 2025. GASTAT’s five-year series also documents changes in mining licenses, mineralization sites, and fertilizer exports between 2021 and 2025.